| Entries |
| S |
|
South Lawndale
|
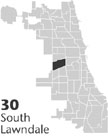 Community Area 30, 5miles SW of the Loop. “Bienvenidos a Little Village.” Traveling under an arch stretching powerfully over 26th Street while heading west at Albany Avenue, a visitor is immediately aware that he or she has entered the
Mexican
and Mexican American enclave of
Little Village,
La Villita.
Situated between the Ste- venson
Expressway
at its southern limits and stretching roughly along Cermak Road to the north, with Western Avenue and Cicero as its east to west boundaries, South Lawndale was settled first in the aftermath of the
Fire of 1871
by
Germans
and
Czechs
(Bohemians). Successive groups such as
Poles,
and now Hispanics, have followed to take advantage of employment opportunities in nearby industry.
Community Area 30, 5miles SW of the Loop. “Bienvenidos a Little Village.” Traveling under an arch stretching powerfully over 26th Street while heading west at Albany Avenue, a visitor is immediately aware that he or she has entered the
Mexican
and Mexican American enclave of
Little Village,
La Villita.
Situated between the Ste- venson
Expressway
at its southern limits and stretching roughly along Cermak Road to the north, with Western Avenue and Cicero as its east to west boundaries, South Lawndale was settled first in the aftermath of the
Fire of 1871
by
Germans
and
Czechs
(Bohemians). Successive groups such as
Poles,
and now Hispanics, have followed to take advantage of employment opportunities in nearby industry.
This blue-collar community area has experienced major economic dislocations since the late 1960s, with the closure of the huge International Harvester plant in the southeast quadrant and the Western Electric complex along its western boundary. The 1990 census recorded a disastrous unemployment rate of 14 percent. Residents have seen jobs disappear in the high-wage industrial sector, so they have sought employment in the service and public sectors. Job training for the economy of the twenty-first century is offered at the West Side Technical Institute, part of the City Colleges of Chicago.
By 2000, 91,071 people made their home in the area. Eighty-three percent were Hispanic, and nearly half were foreign-born. This represented an appreciable increase in South Lawndale's Hispanic population, from 47 percent in 1980 and 4 percent in 1970. As the Hispanic population expanded, ethnic white neighborhoods disappeared as those residents migrated farther west out of the city. Over the last several decades, 40 percent of the total population has been under 20 years of age. With this youthful population, the local public schools have been filled to capacity, and overcrowding has been exacerbated by the financial collapse of parochial schools.
The housing stock dates primarily to the period before World War I. Only 5 percent of the 20,000 housing units standing in 1990 were less than 20 years old. However, commercial revitalization has begun to drive property values higher, with more than 1,600 businesses located along 22nd and 26th Streets. The median home value in 2000 was $105,000, compared to slightly less than $50,000 in 1990. Rental properties that averaged $360 per month in 1990 increased at least 50 percent in the following decade. While not a middle-class community, Little Village has struggled to remain affordable to the working families who attend half a dozen Roman Catholic churches and sustain a thriving commercial life on 26th Street, or Calle Mexico, where a variety of restaurants, shops, and banking institutions provide services. The community also struggles to counterbalance the effects of gang activity.
With more than five thousand inmates, the Cook County Jail and the city of Chicago's House of Corrections add many nonHispanics to the area's overall demographic profile. The Hispanic community has struggled for community-based political representation at least since the 1970s. By the end of the twentieth century, Latinos represented the community in the City Council, the Cook County Board, the Illinois General Assembly, and the U.S. Congress.
| South Lawndale (CA 30) | |||||
| Year |
Total
(and by category) |
Foreign Born | Native with foreign parentage | Males per 100 females | |
| 1930 | 76,749 | 31.5% | 52.1% | 107 | |
| 75,950 | White (99.0%) | ||||
| 679 | Negro (0.9%) | ||||
| 120 | Other (0.2%) | ||||
| 1960 | 60,940 | 17.8% | 32.0% | 102 | |
| 57,278 | White (94.0%) | ||||
| 3,568 | Negro (5.9%) | ||||
| 94 | Other races (0.2%) | ||||
| 1990 | 81,155 | 46.9% | — | 122 | |
| 22,144 | White (27.3%) | ||||
| 7,159 | Black (8.8%) | ||||
| 126 | American Indian (0.2%) | ||||
| 120 | Asian/Pacific Islander (0.1%) | ||||
| 51,583 | Other race (63.6%) | ||||
| 69,131 | Hispanic Origin* (85.2%) | ||||
| 2000 | 91,071 | 48.3% | — | 136 | |
| 26,905 | White alone (29.5%) | ||||
| 12,097 | Black or African American alone (13.3%) | ||||
| 610 | American Indian and Alaska Native alone (0.7%) | ||||
| 173 | Asian alone (0.2%) | ||||
| 68 | Native Hawaiian and Other Pacific Islander alone (0.1%) | ||||
| 48,137 | Some other race alone (52.9%) | ||||
| 3,081 | Two or more races (3.4%) | ||||
| 75,613 | Hispanic or Latino* (83.0%) | ||||
The Encyclopedia of Chicago © 2004 The Newberry Library. All Rights Reserved. Portions are copyrighted by other institutions and individuals. Additional information on copyright and permissions.