| Entries |
| E |
|
Englewood
|
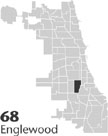 Community Area 68, 7 miles S of the Loop. Before 1850, Englewood was an oak forest with much swampland. In 1852 several
railroad
lines crossed at what became known as Junction Grove, stimulating the beginning of what we know today as Englewood.
Community Area 68, 7 miles S of the Loop. Before 1850, Englewood was an oak forest with much swampland. In 1852 several
railroad
lines crossed at what became known as Junction Grove, stimulating the beginning of what we know today as Englewood.
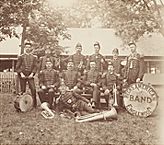
The earliest settlers to Englewood were German and Irish workers. They worked initially on truck farms, the railroads, and later at the Union Stock Yard. By 1865 Junction Grove was annexed to the Town of Lake and then Chicago in 1889. In 1868 Henry B. Lewis, a wool merchant in the Loop and Board of Education member, suggested a new name, Englewood, deriving from his association with Englewood, New Jersey. Also in 1868, developer L. W. Beck gave 10 acres to Englewood for the Cook County Normal School (later Chicago State University), a teacher's college serving the Chicago region. Normal Park developed around the school, paving the way for incoming middle-class homebuyers. In the 1870s Englewood High School was opened.
|
The construction of apartment buildings in the 1910s and 1920s created problems of density and economic segregation. By 1920 the population soared to 86,619 and Englewood's shopping district at Halsted and 63rd was the second busiest in the city. In 1929, Sears developed a $1.5 million store here. The Great Depression years did not affect the operation of the larger stores, but many smaller ones suffered and several banks in Englewood closed.
The 1940s witnessed a decline of real-estate values in Englewood. Buildings were 40 years old, and the expanding Black Belt population from the east resulted in rapid turnover. Materials necessary to redevelop Englewood were scarce owing to World War II, and later practices of redlining and disinvestment sealed Englewood's future as a low-income community with a declining housing stock. In 1959, a Chicago Sun-Times writer interviewed a banker about lending in Englewood. His reply illuminates attitudes among lenders at the time. “When a lender makes a loan on a house, he looks at the total financial position of the borrower. The rate is determined by risk. The Negro has to pay a higher rate because he is not as secure in his job.”
While some economic gains by African Americans gave them the opportunity to purchase some of the larger houses in Englewood, many low-income residents rented in more crowded conditions. In 1940 blacks constituted just 2 percent of the population, but this increased to 11 percent in 1950, 69 percent in 1960, and 96 percent by 1970. In 1960 the population peaked at over 97,000 people, despite the exodus of 50,000 whites. Public works projects such as the Dan Ryan Expressway and patterns of housing abandonment and deterioration led to a massive loss of housing stock. Further, attempts at restoring the shopping district through public funds have been unsuccessful. This is due in part to competition from shopping centers built in the 1960s not far away (such as Evergreen Park and Ford City). By the 1970s, Sears and Wieboldt's had closed, and Chicago State University had moved to 95th Street in Roseland. By the end of the century about 100 shops were still operational, with over 75 percent managed by Korean and Pakistani merchants. Englewood's population declined to 59,075 by 1980 and to 40,222 by 2000. Despite the 200 housing units built by the Antioch Baptist Church and some publicly funded apartments for elderly and handicapped persons, few communities in Chicago have lost as much population or housing stock in the twentieth century.
| Englewood (CA 68) | |||||
| Year |
Total
(and by category) |
Foreign Born | Native with foreign parentage | Males per 100 females | |
| 1930 | 89,063 | 21.8% | 36.4% | 101 | |
| 87,873 | White (98.7%) | ||||
| 1,126 | Negro (1.3%) | ||||
| 64 | Other (0.1%) | ||||
| 1960 | 97,595 | 4.3% | 8.1% | 94 | |
| 30,107 | White (30.8%) | ||||
| 67,216 | Negro (68.9%) | ||||
| 272 | Other races (0.3%) | ||||
| 1990 | 48,434 | 0.9% | — | 83 | |
| 209 | White (0.4%) | ||||
| 47,963 | Black (99.0%) | ||||
| 51 | American Indian (0.1%) | ||||
| 105 | Asian/Pacific Islander (0.2%) | ||||
| 106 | Other race (0.2%) | ||||
| 231 | Hispanic Origin* (0.5%) | ||||
| 2000 | 40,222 | 1.0% | — | 83 | |
| 242 | White alone (0.6%) | ||||
| 39,501 | Black or African American alone (98.2%) | ||||
| 44 | American Indian and Alaska Native alone (0.1%) | ||||
| 28 | Asian alone (0.1%) | ||||
| 7 | Native Hawaiian and Other Pacific Islander alone (0.0%) | ||||
| 122 | Some other race alone (0.3%) | ||||
| 278 | Two or more races (0.7%) | ||||
| 347 | Hispanic or Latino* (0.9%) | ||||
The Encyclopedia of Chicago © 2004 The Newberry Library. All Rights Reserved. Portions are copyrighted by other institutions and individuals. Additional information on copyright and permissions.